Following an explanation of the methodology to automatically infer origins and destinations, this chapter positions this research within the context of transportation and transit equity analysis in the USA. First is presented a history of transportation equity regulations in the USA, followed by a review of critiques of the current state of equity analyses in transportation. Next comes a discussion of recent studies on equity in Boston including an examination of the most recent Federal Transit Administration (FTA)-required equity analysis of the MBTA and this procedure is critiqued in light of the state of the literature. Opportunities to integrate ADCS, in particular the OD inference developed for this research, into the three required forms of equity reporting are discussed. From this is developed a framework and methodology applied in subsequent chapters to the inferred OD data as a pilot alternative to the FTA-required analysis.
History of Transportation Equity Analysis in the USA
1964 Title VI of the Civil Rights Act
At the Federal level, equity is first considered to have entered transportation planning with the passing of the Civil Rights Act of 1964. Title VI of this act prohibits programs and agencies receiving federal funding from discriminating based on race, color, or national origin. Despite this, highways were frequently built through minority neighborhoods, giving the largely transit-dependent populations little benefit while burdening them with noise and pollution (Bullard, 2004; Sanchez, Stolz, & Ma, 2004).
In 1970 the U.S. Department of Transportation (USDOT) issued 35 FR 10080, a federal regulation requiring its agencies to comply with Title VI. It prohibited using “criteria or methods of administration which have the effect of subjecting persons to discrimination because of their race, color, or national origin” (49 C.F.R. § 21.5, emphasis added). Thus, transportation outcomes can be found to have a discriminatory element, without intent having to be proven. Regarding reporting, the requirement stated that funding recipients “should have available […] racial and ethnic data showing the extent to which members of minority groups are beneficiaries of programs receiving Federal financial assistance” (49 C.F.R. § 21.9). In 1972 the Urban Mass Transportation Administration (UMTA, now FTA) began requiring its funding recipients to provide assessments of compliance with Title VI. UMTA’s rule stated that non-compliance could be judged based on disparate outcomes, whether the act, or failure to act, was intentional or unintentional (Urban Mass Transportation Administration 1975, Circular 1160.1, as quoted by Pucher (1982)). Pucher found that capital and operating subsidies had been distributed to modes such as commuter rail and subways which were disproportionately used by higher-income and non-minority riders.
In 1988 UMTA’s guidance was updated and included specific requirements on reporting. Census tracts or traffic analysis zones (TAZ) whose proportion of minority residents was greater than the agency’s service-area proportion had to perform comparisons with non-minority geographic units in that service area. The Level of Service Methodology required an assessment of routes based on service standards adopted by the agency (e.g. vehicle load, schedule adherence, transit amenities) and a comparison between the average performance of routes serving minority areas versus non-minority areas. The Quality of Service Methodology required determining travel patterns for a sample of minority and non-minority areas. For the top 3 destinations, metrics such as peak travel time and cost should be compared (UMTA C 4702.1).
ISTEA and the Clinton Environmental Justice Executive Order
The Intermodal Surface Transportation Efficiency Act (ISTEA), enacted by Congress in 1991 expanded the roles of metropolitan planning organizations (MPOs) to plan and allocate transportation funding by providing direct federal funding to them. This put MPOs under requirements to follow Title VI and therefore regional transportation plans could not discriminate against Title VI’s categories of protected populations (Karner & Niemeier, 2013).
In the late 80s and early 90s, a number of studies found that Federal agencies—in particular the Environmental Protection Agency—were applying laws in a disparate manner depending on the income and the race of affected communities. For example, hazardous waste facilities were being disproportionately sited in minority communities, and the EPA was found to regulate Superfund sites more strictly in predominantly White areas. Following these accusations the Clinton Administration issued Executive Order 12898 (La Londe, 2004). The Order directs agencies to identify and address disproportionately high adverse impacts on protected populations, expanding protected groups beyond the Title VI definition to include low-income populations (Clinton, 1994). This Order was operationalized by the US Department of Transportation (USDOT) with Proposed and Final Environmental Justice Orders in 1995 and 1997, respectively (USDOT, 1997). DOT guidance included social and economic effects as outcomes to identify along with human-health and environmental effects.
Despite this order to ensure equitable outcomes, Gobillon et al. (2007) found in a review of studies published after 1998 that transportation planning and transit access to low-skilled jobs (due to lower auto ownership among low-income households (Taylor & Ong, 1995)) still had a significant role in maintaining the spatial mismatch hypothesis (Kain, 1968): that inner-city, primarily Black and low-skilled workers, were cut off from employment opportunities which had migrated to the suburbs.
The 2001 Supreme Court decision in Alexander v. Sandoval limits the means of redress of disparate impacts proscribed under Title VI to administrative action only. The Court held that the original framing of Title VI gave the right to legal recourse to cases with demonstrated discriminatory intent rather than discriminatory effects (Laufer, 2002). In 2011 the Ninth Circuit Court of Appeals used this decision to require proof of discriminatory intent when an alliance of minority bus riders and advocates filed suit against the San Francisco Bay Area MPO (the Metropolitan Transportation Commission) for disparately subsidizing rail trips instead of bus trips. Unable to successfully prove such intent, the case failed (Golub, Marcantonio, & Sanchez, 2013). Federal regulation still requires agencies to assess, report, and remedy disparate outcomes, however the right for advocates to pursue legal remedy for these outcomes has been removed.
Current FTA Requirements
The most recent FTA reporting procedure was published in 2007 (Federal Transit Administration, 2007) and updated in 2012 (Federal Transit Administration, 2012a) for clarity. It requires agencies operating 50 or more fixed route vehicles serving populations over 200,000 to conduct the analyses outlined in Table 3.1.
Table 3.1 FTA required reporting
| Analysis Required | Frequency |
|---|---|
| Disparate Impacts & Disproportionate Burden | Fare increase or major service change |
| Transit Service Monitoring | Every three years |
| Demographic and service profile maps and charts | Every three years |
| Survey data regarding customer demographic and travel patterns | A minimum of once every 5 years |
Service monitoring and demographic analyses are included in agencies’ triennial “Title VI Program” which documents efforts to comply with Title VI and EJ regulations submitted to the FTA for approval (Federal Transit Administration, 2012a, IV-1). The guidance on survey efforts is as follows (Federal Transit Administration, 2012a, IV-8-9):
Fixed route providers of public transportation that meet the threshold in the Introduction section of this chapter shall collect information on the race, color, national origin, English proficiency, language spoken at home, household income and travel patterns of their riders using customer surveys. Transit providers shall use this information to develop a demographic profile comparing minority riders and non-minority riders, and trips taken by minority riders and non-minority riders. Demographic information shall also be collected on fare usage by fare type amongst minority users and low-income users, in order to assist with fare equity analyses. The demographic information shall be displayed in tabular format. […]
The information required in this subparagraph may be integrated into passenger surveys employed by transit providers on a schedule determined by the transit provider but no less than every five years and may be collected at the time that such surveys are routinely performed, such as customer satisfaction surveys and origin and destination surveys used to update travel demand models. Transit providers should contact FTA for further guidance on survey sample sizes, data expansion procedures, and data collection methods suitable to the transit provider’s specific situation.
The monitoring requires comparison for each provided mode between minority and non-minority routes: defined as routes in “in which at least one-third of the revenue miles are located in a Census block, Census block group, or traffic analysis zone where the percentage minority population exceeds the percentage minority population in the service area. Transit providers may supplement this with ridership data and adjust route designations accordingly.” (Federal Transit Administration, 2012a, IV-9) (See section 3.2) This adjustment may be made if “ridership does not reflect the characteristics of the census block, block group, or traffic analysis zone.” (Federal Transit Administration, 2012a, I-4) After determining the status of routes, agencies must evaluate route performance based on service standards. The FTA prescribes the indicators but not the standards. Limiting this list to indicators which can be measured using ADCS these include but are not limited to:
- Vehicle load
- Scheduled headway
- On-time performance (schedule adherence, or punctuality)
- Service availability (density of coverage)
Disparate impacts are found if the service meets agency standards inequitably, using a test decided upon by the agency, and approved by the FTA. Typically this is the “4/5ths rule,” where disparate impact exists if a protected population experiences less than 80% of benefits (TPCB, 2011) although a 95% rule (BART, 2013) and 95th percentile confidence t or χ statistical tests (Reddy, Chennadu, & Lu, 2010) are also used. If disparate impacts are found, the agency is required to “take corrective action to remedy disparities to the greatest extent possible” (Federal Transit Administration, 2012a, IV-10).
Critiques of the Equity Analysis State of the Practice
Equity analysis regulation has been influenced by the availability of data and modeling capacity, but the state of regulations have not kept pace with advances in modeling, computation, and data collection capabilities. They have also been influenced by the idea of “neighborhood effects,” that disparate impacts, such as pollution, affect a population uniformly. But the social and economic benefits of transportation are linked to the access provided by the broader network at any given entry point. Analyses delineating geography between protected and reference populations assumes a homogeneity of population within that unit of analysis when the heterogeneity of behavior can result in an uneven distribution of transportation benefits within (Bills, 2013; Karner & Niemeier, 2013). For example, due to the mismatch in automobile ownership and employment, black and white residents in primarily minority tracts can have different commute times and distances (Taylor & Ong, 1995). Ridership of two “Rapid” bus routes in Phoenix is disproportionately white compared to their catchment demographics. The Title VI analysis for the introduction of these routes was made using census data. Had the ridership data been used, a disparate benefit accruing to White customers would have been found (Karner & Golub, 2015). There is also an assumption that effects on minorities are equivalent, when in many cities Black and African Americans have been disproportionately burdened relative to other minorities (Gobillon et al., 2007; Williams, Pollack, & Billingham, 2014)
For service performance, the unit of analysis is a route. Routes are determined to be minority based on the proportion of revenue-miles through minority tracts, when route boardings are not likely to be uniform and boardings within a tract do not necessarily reflect the demographics of that tract. The labeling of a route as minority based on the actual ridership of that route is up to the discretion of the agency. Following the identification of route status, performance is aggregated by minority status for each mode, further erasing consideration of ridership. Ridership is not evenly distributed amongst routes, and the fraction of routes experiencing sub-standard performance can be different from the fraction of riders, minority or otherwise, who experience sub-standard performance.
Bills (2013) recommends using metrics estimated at an individual level and then examining the distribution of these metrics to identify individuals who are better or worse off. This would also make it easier to identify the causes of disparities in order to correct them.
Absent from the guidance is a requirement for sensitivity analysis: “How do different target populations, metrics, and definitions of equity affect the results of the analysis?” (Karner & Niemeier, 2013)
A more comprehensive equity analysis would have individual outcomes as the unit of analysis and examine the distributions of these for different race and income categories. Where possible, the analysis unit of comparison should reflect actual ridership rather than approximations such as routes or route miles or stops or stations.
Examples of Transit Equity Analysis from other US Agencies
A search of the 12 Metros in the USA with subways found publicly available Title VI Service Monitoring Reports for only the MBTA and Bay Area Rapid Transit (BART), which confirms that FTA triennial Title VI reports are not widely distributed by agencies (Reddy et al., 2010).
The BART system runs on distance-based fares, resulting in origin, destination and travel time being collected for every customer trip. From these data the analysts derive a customer-based on-time performance metric, based on the difference between actual and scheduled travel time for each customer journey. However due to the difficulty in assigning performance to lines when many stations share multiple lines, these metrics are not aggregated to each line to be used in their Title VI reporting. The analysis also compares the demographics of catchment areas based on the census to the actual demographics of riders boarding at stations and revises the minority status of stations based on the ridership survey data, changing 3 stations from minority to non-minority, and one station from non-minority to minority status.
Examples using Automatically Collected Data for Equity Analyses
Despite not making its triennial Title VI Reports to the FTA publicly available, NYC Transit (NYCT) has published a number of its methodologies in peer-reviewed literature. As a consequence of the 2008 recession, NYCT faced a significant budget shortfall for 2009 and thus had to propose fare hikes and service restructuring.
For both analyses they used thresholds to determine protected Census tracts based on averages for the entire city. According to the 2000 Census NYC was 65.02% minority. Only geographic units exceeding this threshold were considered to be minority—that is, a geographic unit that contained a population with a majority of minority residents might still not be considered a minority unit (for example, if the unit was 50 to 65.01 % minority). This threshold was chosen over a 50% threshold because with the latter gives rise to “most of the city being classified as minority and giving rise to analysis that would not be sensitive to actual disparities between heavily-minority areas versus somewhat-minority areas” (Wang, Lu, & Reddy, 2013). Minority status was not disaggregated into different race or ethnic categories in order to determine if different minorities experience different outcomes. Tracts were considered low-income if 21.25% or more of residents were below the poverty line.
The magnitude of the 2009 hike was severe enough that NYCT decided to explore new ways to analyze equity in order to challenge assumptions made in previous analyses. They developed a method to estimate average fares experienced by individual farecard holders, and assigned minority/non-minority and low-income/high-income status to individual farecard holders based on the status of the stations or bus routes that they first swiped in at. For each mode, t-tests were conducted, and statistically significant disparities were found. Since the fare hike was designed to correct previous inequities in fare policy, the proposed hikes were proven to affect non-minorities, and higher-income individuals more severely (Hickey, Lu, & Reddy, 2010).
In addition service reductions were proposed such as subway and bus route changes including service elimination, span changes, and route modifications (Wang et al., 2013).
For span changes on bus routes: load factors were computed based on average AFC boardings relative to the number of seats on the vehicles used during the time periods to be cut. They determined the status of bus routes based on the 1/3 revenue mileage rule: if 1/3 of the revenue mileage of a route passed through tracts labelled as minority, then the route was classified as minority. Disparities were determined if the average load factor for routes with protected status was significantly different from routes without that status. This did not appear to take into account the ridership on the spans to be cut: whether more protected riders were affected by the service cut than high-income non-minority riders.
For subway and bus route changes travel time was the metric analyzed with each route considered individually. Two OD matrixes were developed from the 2000 Census Journey-to-Work data for minority tracts and non-minority tracts. For each route, the top 5 minority and top 5 non-minority origin tracts within ¼ mile of the route to be modified were selected, and then the top 3 destinations were selected for each. For these 15 OD pairs the shortest path using the route is the initial condition. Since the analysts were unable to change the network structure in the journey planner, the shortest path without the changed route was the changed condition. Travel time and cost are calculated for each and a t-test was conducted to determine if the differences in travel time between minority and non-minority OD pairs was equitable. Had an inferred OD matrix been available (with inferred home locations as per Section 4.3), the data used would have been more current than 9 year old Census data. Moreover, with a more robust way of computing shortest-path travel times, the full set of OD pairs using that route could have been used, rather than the top 30. With disaggregate OD data, the t-test would have based on distributions of individual travel times rather than a limited subset of OD pairs travel times.
Previous Analyses in Boston
Williams et al. (2014) analyzed the transportation equity of the Boston-Cambridge-Newton, MA-NH metropolitan statistical area (MSA). They used data from the American Community Survey (ACS), which is an annual supplement to the census sampling approximately one percent of the American population. Data is provided in 1-year, 3-year, or 5-year packages scaled to represent the full population. The ACS questionnaire includes questions about a respondent’s race and the mode and duration of their journey to work. The researchers used the ACS data in the form of Public Use Micro-Samples (PUMS), which are individual responses, weighted to represent the full population. To protect the anonymity of responses, these are anonymized to geographies encompassing a minimum of 100,000 residents known as Public Use Microdata Areas (PUMAs). Their primary finding was that the starkest travel time differential between races after controlling for a number of confounding and related factors was between Black and White commuters. The difference is greatest between bus users, which is the mode most used by Black public transit users. However, due to the spatial resolution of the data used, and the lack of data on distance, it is difficult to identify causes and solutions for this disparity beyond calling on greater consideration of race in transportation planning.
MBTA’s Title VI & EJ Reporting
The triennial equity analysis of the MBTA’s service is performed by the Central Transportation Planning Staff, which is directed by the Boston Region MPO. The most recent report was published May 2014 (Central Transportation Planning Staff, 2014) and is publicly available online[7]. The 2010 system-wide survey results show the greatest proportion of minority ridership on buses (47%) and a greater tendency for them to use cash on bus (3% to 2%) and to use 7-Day passes (Bus: 8% to 4%, Rapid Transit: 7% to 3%). Low-income riders are more likely to use cash on bus (3% to 2%) and to use 7-Day passes (Bus: 8% to 3%, Rapid Transit: 9% to 3%) and less likely to use Monthly passes (Bus: 49% to 66%, Rapid Transit: 53% to 69%). Minority riders are more likely to use transit four or more times a week (Bus: 82% to 73%, Rail 86% to 77%).
Minority Classification
Census tracts are designated as protected if they exceed the average proportion of minority residents of 26.2% for the entire MBTA service area, 175 municipalities served by bus, rapid transit, boat, or commuter rail within Massachusetts. Prior to the 2010 Census the analysis had been performed for 2 different zones: the urban fixed-route service area (65 municipalities) and the commuter rail service area (175 municipalities).
Improving upon the revenue-mile approximation, a bus or rapid transit route is designated as minority if 40% of its boardings occur in minority census tracts. Boardings are measured using APC on buses, AFC at rapid transit stations, and manual ride checks where the previous data is not available, such as the surface light rail,
Metrics
A disparate impact was found “if the performance of a service provided to minority areas passed the service standard at a rate less than 80 percent of the service provided to nonminority areas.” (CTPS, 2014, 6-5).
Bus:
Vehicle Load: Disparate impact is based on the percentage of routes that pass the standard, which is based on the peak passenger load relative to the number of seats. For all 3 types of service (Weekday, Saturday, and Sunday) though there is a slightly lower proportion of minority routes that meet the standard, this proportion is only below 80% of non-minority service, resulting in a finding of disparate impact, on Sundays.
Schedule Adherence: For bus, 75% of timepoints on route must pass the on-time criteria which is either schedule-based for service with a headway greater than 10 minutes or headway-based for high-frequency service. All high-frequency minority routes have better headway adherence than non-minority routes, although only 65.2% of minority routes pass on Weekdays. Low-frequency minority routes are disparately affected on the Weekday Schedule Adherence Standard: 22.3% of minority routes pass versus 32.7% non-minority routes.
Rail:
All heavy rail lines have over 40% of boardings occurring in minority tracts so no comparison is possible.
Light-rail:
Vehicle load: All lines pass the vehicle load standard during weekdays.
Schedule adherence: None of the lines pass the schedule adherence on Weekdays except for the Mattapan High-Speed Line. This results in no disparate impact since a greater proportion of minority light-rail lines passes the standard (1 of 4) than non-minority (0 of 1), even though the number of minority lines failing the standard is greater than the number of non-minority lines failing the standard.
Comparison of Boston Analyses
The point of this comparison is not to identify inaccuracies in either analysis, but to highlight how the use of different metrics and methodologies to estimate them can lead to differing conclusions. According to Williams et al. (2014), there are differences in travel time on subway, but the supply side equity analysis demonstrates no possibility for comparison because all lines are considered minority. This shows a failing of the FTA’s reporting requirements to reflect the passenger experience. That travel times are significantly different for different ethnicity categories highlights the problem of treating the minority population as a homogeneous group rather than investigating different groups individually.
For bus travel, that no disparate impact is found for high-frequency bus headway adherence when bus riders have such disparate travel times shows, in part, the consequence of not incorporating ridership into findings of disparate impacts. What proportion of minority riders bear the burden of routes that are not on time compared to non-minority bus riders? For both these cases behavior and the built environment are likely contributors to these disparate travel times. The report analyses a number of supply metrics representing accessibility to the network, including stop availability, and on-time performance, which affects out of vehicle waiting time. But it does not ask whether the network is configured to adequately supply the needs of all riders, when according to the disparate travel times found by Williams et al. (2014), the network is not fulfilling these.
Using ADCS to Improve Title VI & EJ Reporting
This section examines how ADCS, and the inferred OD from this research, can improve the FTA required analyses:
- surveying demographics and ridership patterns
- analyzing fare changes and major service changes
- service monitoring
Surveying Demographics
It is clear that under the current regulation, the following must be collected by a customer survey: “race, color, national origin, English proficiency, language spoken at home, household income and travel patterns” (FTA, 2012, IV-6). Since the ACS has questions on all those attributes except English proficiency, the combination of matching inferred OD and originating neighborhood demographics could satisfy the spirit of the requirements. This would need to be arranged between individual agencies and the FTA.
Maintaining the need to survey, it would be possible to survey ridership system-wide, asking for farecard numbers in order to match farecards with the required demographic information, thus satisfying the travel pattern reporting requirement. If there was an additional, or subsequent, prompted recall segment to the survey, as piloted in Boston by Chow (2014), it would provide an opportunity to validate OD estimation and the subsequent home location inference. This survey technique would still have to account for uneven demographic distribution of fare media, such as the required targeted sampling of users who pay cash in order to collect their travel behavior. The ability to link travel behavior to survey results through fare data could reduce the need for mass distribution of surveys on a route-by-route basis, increasing the accuracy of information about users’ transit trips by eliminating the need for trips to be self-reported and increasing the volume of trips captured in the survey by permitting many days of activity to be linked to user demographics.
Analyzing Fare Changes and Major Service Changes
Fare Changes
The NYCT method described in Section 3.3.1 on page 46 is exemplary of the potential for combining disaggregate fare data with census data. The use of inferred OD and home location inference on all modes would better capture variations in demographics by census tract.
Major Service Changes
For all service changes, travel time should be the metric used for analysis and disparate impact examining distributions of changes in travel times due to proposed modifications as per Bills (2013). This requires a network model capable of generating stop-level OD travel times based on modified networks. For span reductions, analysis should first examine the potential for customers to use alternative service. If alternate service is infeasible, then should be determined whether the proportion of affected riders is disproportionate with respect to the population.
Service Monitoring
The use of inferred origins, or APC if inferred OD is not available, and ACS data should be used to determine the number of riders with protected status affected by vehicle loads and schedule adherence that fail performance standards in order to determine disparate impacts. Vehicle load is a good measure of passenger discomfort from failing service, while also providing some information about where, when, and whether passengers are left behind.
Ideally schedule adherence should be replaced with a passenger-centered metric such as excess journey time (i.e., the difference between a passenger’s actual and scheduled journey times) used by BART (2013) to better measure poor service. Additionally the distribution of passenger journey times should be examined to determine whether the network can be better configured to serve customer needs.
Limitations of Inferred OD
There are three categories of population for which OD information, by its nature, provides limited insight for equity analyses:
- Individuals who have the ability to switch to modes such as auto to avoid onerous transit trips
- Individuals who have no available transit
- Individuals who access transit by non-walking modes such as driving or biking.
The consideration of the first two categories of persons begs the question for which population must service be equitable: should service be equal to all persons, regardless of whether they choose to take transit? The FTA guidance is unclear in answering this question, since it allows the use of either ridership or census data to determine the demographics of interest for an equity analysis. Yet the use of census demographics has been shown to allow service that disproportionately benefits the non-minority residents of minority areas to be deemed equitable by the standards (Karner & Golub, 2015). Agencies such as BART will revise classifications of minority status if ridership demographics at stations are different than those of the catchment area (BART, 2013). The use of trips with inferred origins and destinations as the unit of measurement will weigh the analysis towards transit riders who, by choice or necessity, use it regularly. Access to an automobile, and the ability to forego an undesirable transit in favor of an auto is correlated with race and income and Williams et al. (2014) controlled for this in their regression of travel times, adding a zero-auto household dummy variable. This variable was significant and positive: the absence of an automobile correlates with an increased commute time of one minute. This which would support the auto selection bias, but did not eliminate the difference in travel time found by their regression
The MBTA’s service provision coverage guidelines are explicitly different between areas where population density is greater than 5,000 persons per square mile, and areas where it is not. In the former, it is assumed that users walk to service, and thus, in areas where there is bus, light rail, and/or heavy rail service, residents should be within at most ¼ mile walk of the network for weekday service. This does not apply to areas with densities lesser than 5,000 persons per square mile, or those served by commuter rail or commuter boat, since it is assumed that users in those areas drive (MBTA, 2010).
The use of inferred OD assumes equivalent access time, or rather, implicitly excludes it. Due to housing availability in the inner city, or low stop density in the suburbs, this may not be true, as some users may have to travel greater distances to access transit.
Inferred OD will only measure trips that users actually make, and as mentioned above, there are limits to this information. It is beyond the scope of this thesis to make the judgment about how equity ought to be decided, but this does not preclude the use of the methodology proposed to inform transit agencies about the variation in usage by the demographics of users’ origins. This information could additionally be used by MPOs, which consider all modes, to evaluate the effectiveness of regional transportation plans.
Proposed Metrics and Methodology
The remainder of this thesis will provide an example analysis of service monitoring using passenger travel time and speed as a performance metric. Travel time an important indicator of the temporal burden of using transit to access opportunities, and one for which disparities by race have already been identified in the Boston Metro Area (Williams et al., 2014).
The procedure will demonstrate how inferred OD can be used to monitor service quality, while also improving upon previous identification of disparities to examine causes of travel time disparities, determining if the following factors apply:
- the spatial mismatch of housing and jobs resulting in greater travel distance
- lower vehicle travel speeds
- or a network improperly configured for the needs of minority commuters.
After identifying causes, potential solutions can be proposed. This concluding section will first update the findings from the 2010 ACS to include distributions of travel time using the most recent ACS.
Most Recent ACS
The analysis below uses the 5-year estimates for 2013, the most recent year for which data is available. ACS data is available in PUMS (see section 3.4 for a description). Any PUMA which intersects an MBTA bus or rapid transit route was used (Figure 3.1). Only responses for people who commuted by bus, streetcar, and heavy rail commuters were used.
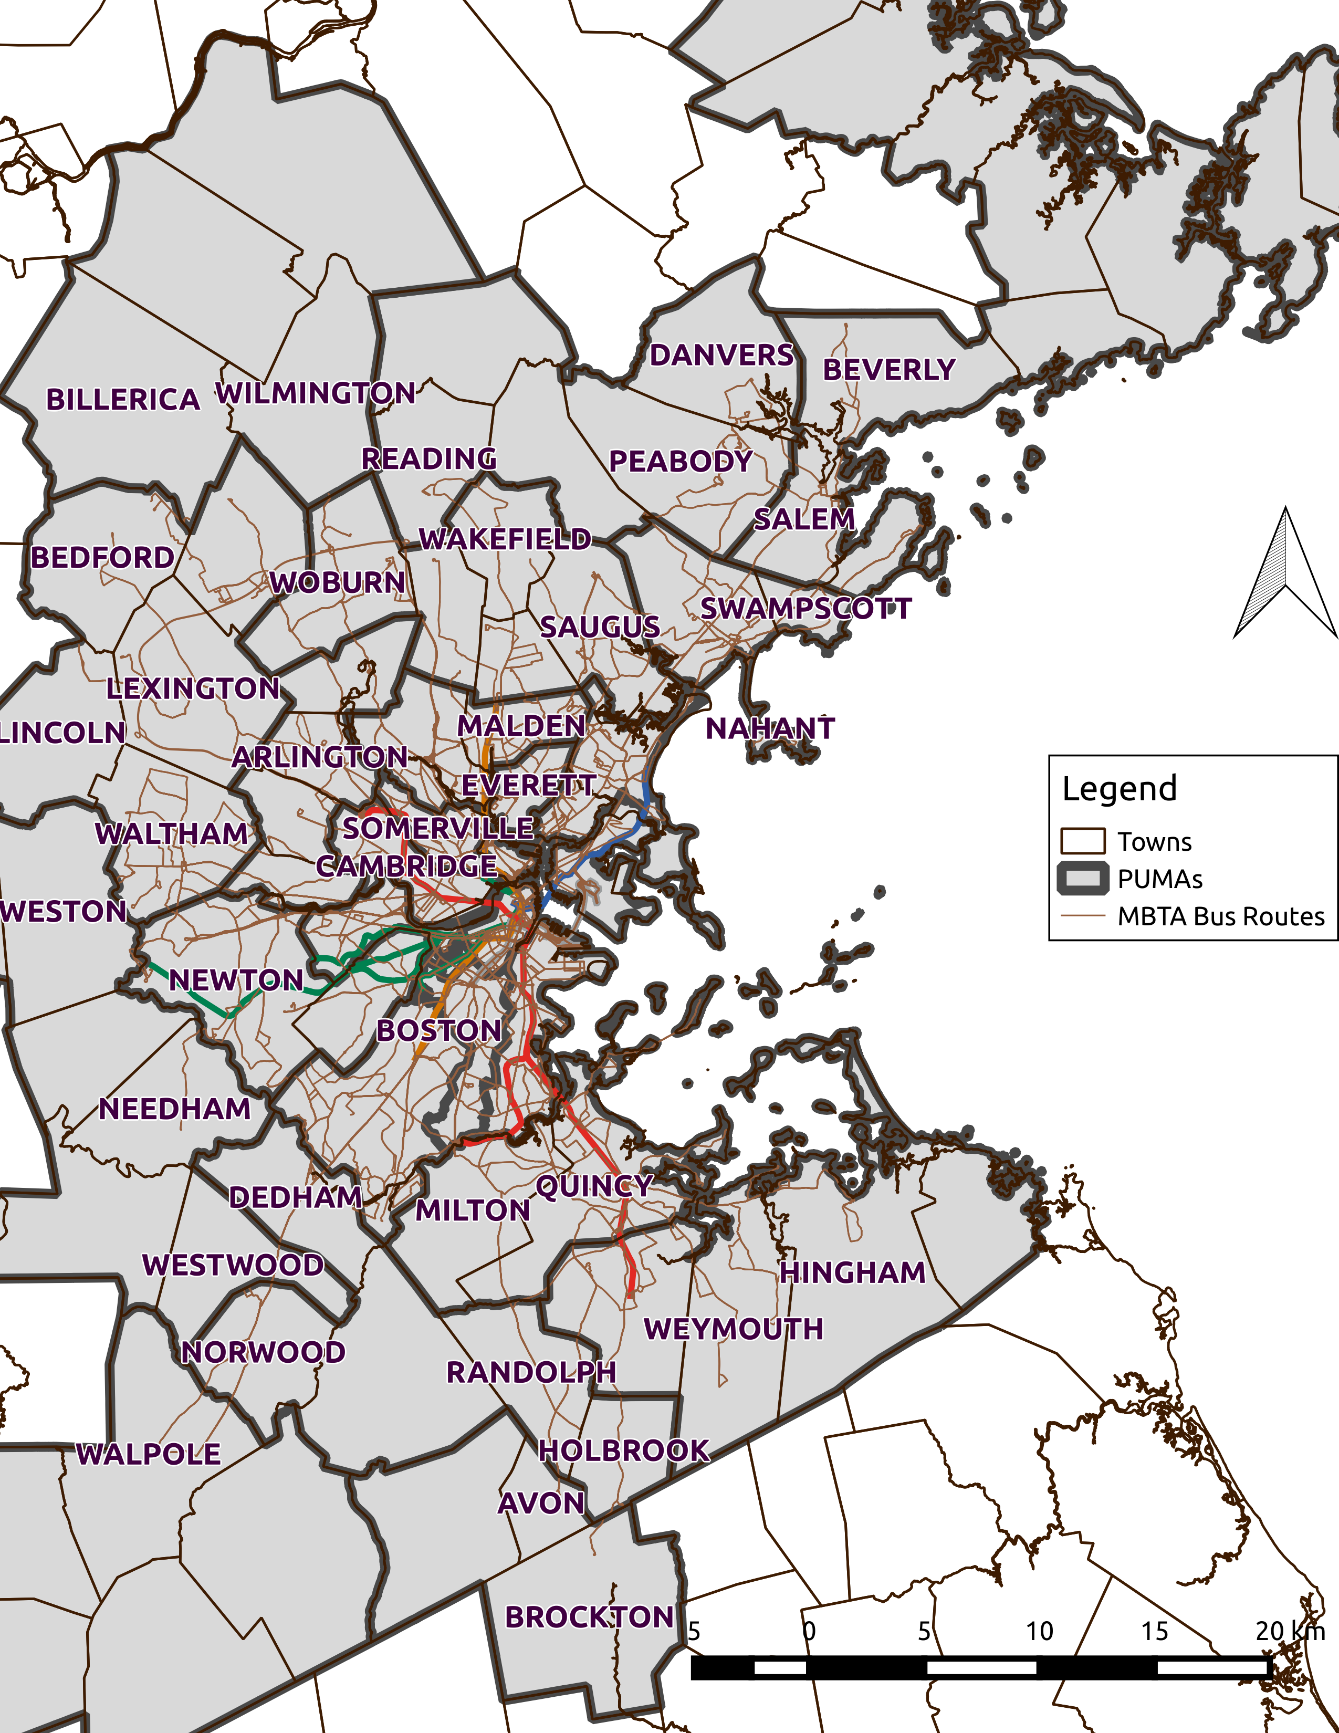
Figure 3.1 PUMAs which intersect MBTA Rapid Transit or Bus
Table 3.2 shows the average commute time for users who travelled by public transit (bus, rail, or LRT) by different race or ethnicities. Only commuters who identify as White and Other have an average commute time below the average population, with the greatest difference being between those who identify as Black or African American, and those who identify as White. The proportion of bus riders who are White is 52%, which is comparable to the CTPS 2010 survey value of 53%, however there is a difference of 10% between the ACS 63% White Rapid Transit riders and the CTPS 73% White proportion.
Table 3.2 Average Public Transit Commute Time by Race
| Race | Average Journey to Work Time (min) | Number of Public Transit Commuters |
|---|---|---|
| **White alone ** | 39.3 | 120,461 |
| **Some Other Race alone ** | 40.8 | 10,217 |
| Two or More Races | 41.2 | 10,475 |
| Native American | 42.7 | 547 |
| **Asian alone ** | 43.1 | 22,828 |
| **Black or African American alone ** | 45.0 | 33,600 |
| Average | 40.9 | 198,128 |
The distribution of these travel times is important, and the distributions for Asian and Black or African American commuters are shown in Figure 3.2 and Figure 3.3, with the White Alone population as reference. The graphs are smoothed using a kernel density because respondents tend to report their travel times in 10 or 15 minute increments. Given the discrete nature of responses, and their clustering in 15 minute increments, smoothing was applied to the graphs. The Asian distribution is similar to the White Alone one except for a shift to the right, with increased proportions of trips taking 45, 60, and 90 minutes. The Black or African American distribution shows a slightly greater proportion of commuters with really short travel times, but mostly the distribution also shows a substantial proportion of lengthier commutes, in particular above 60 and 90 minutes.
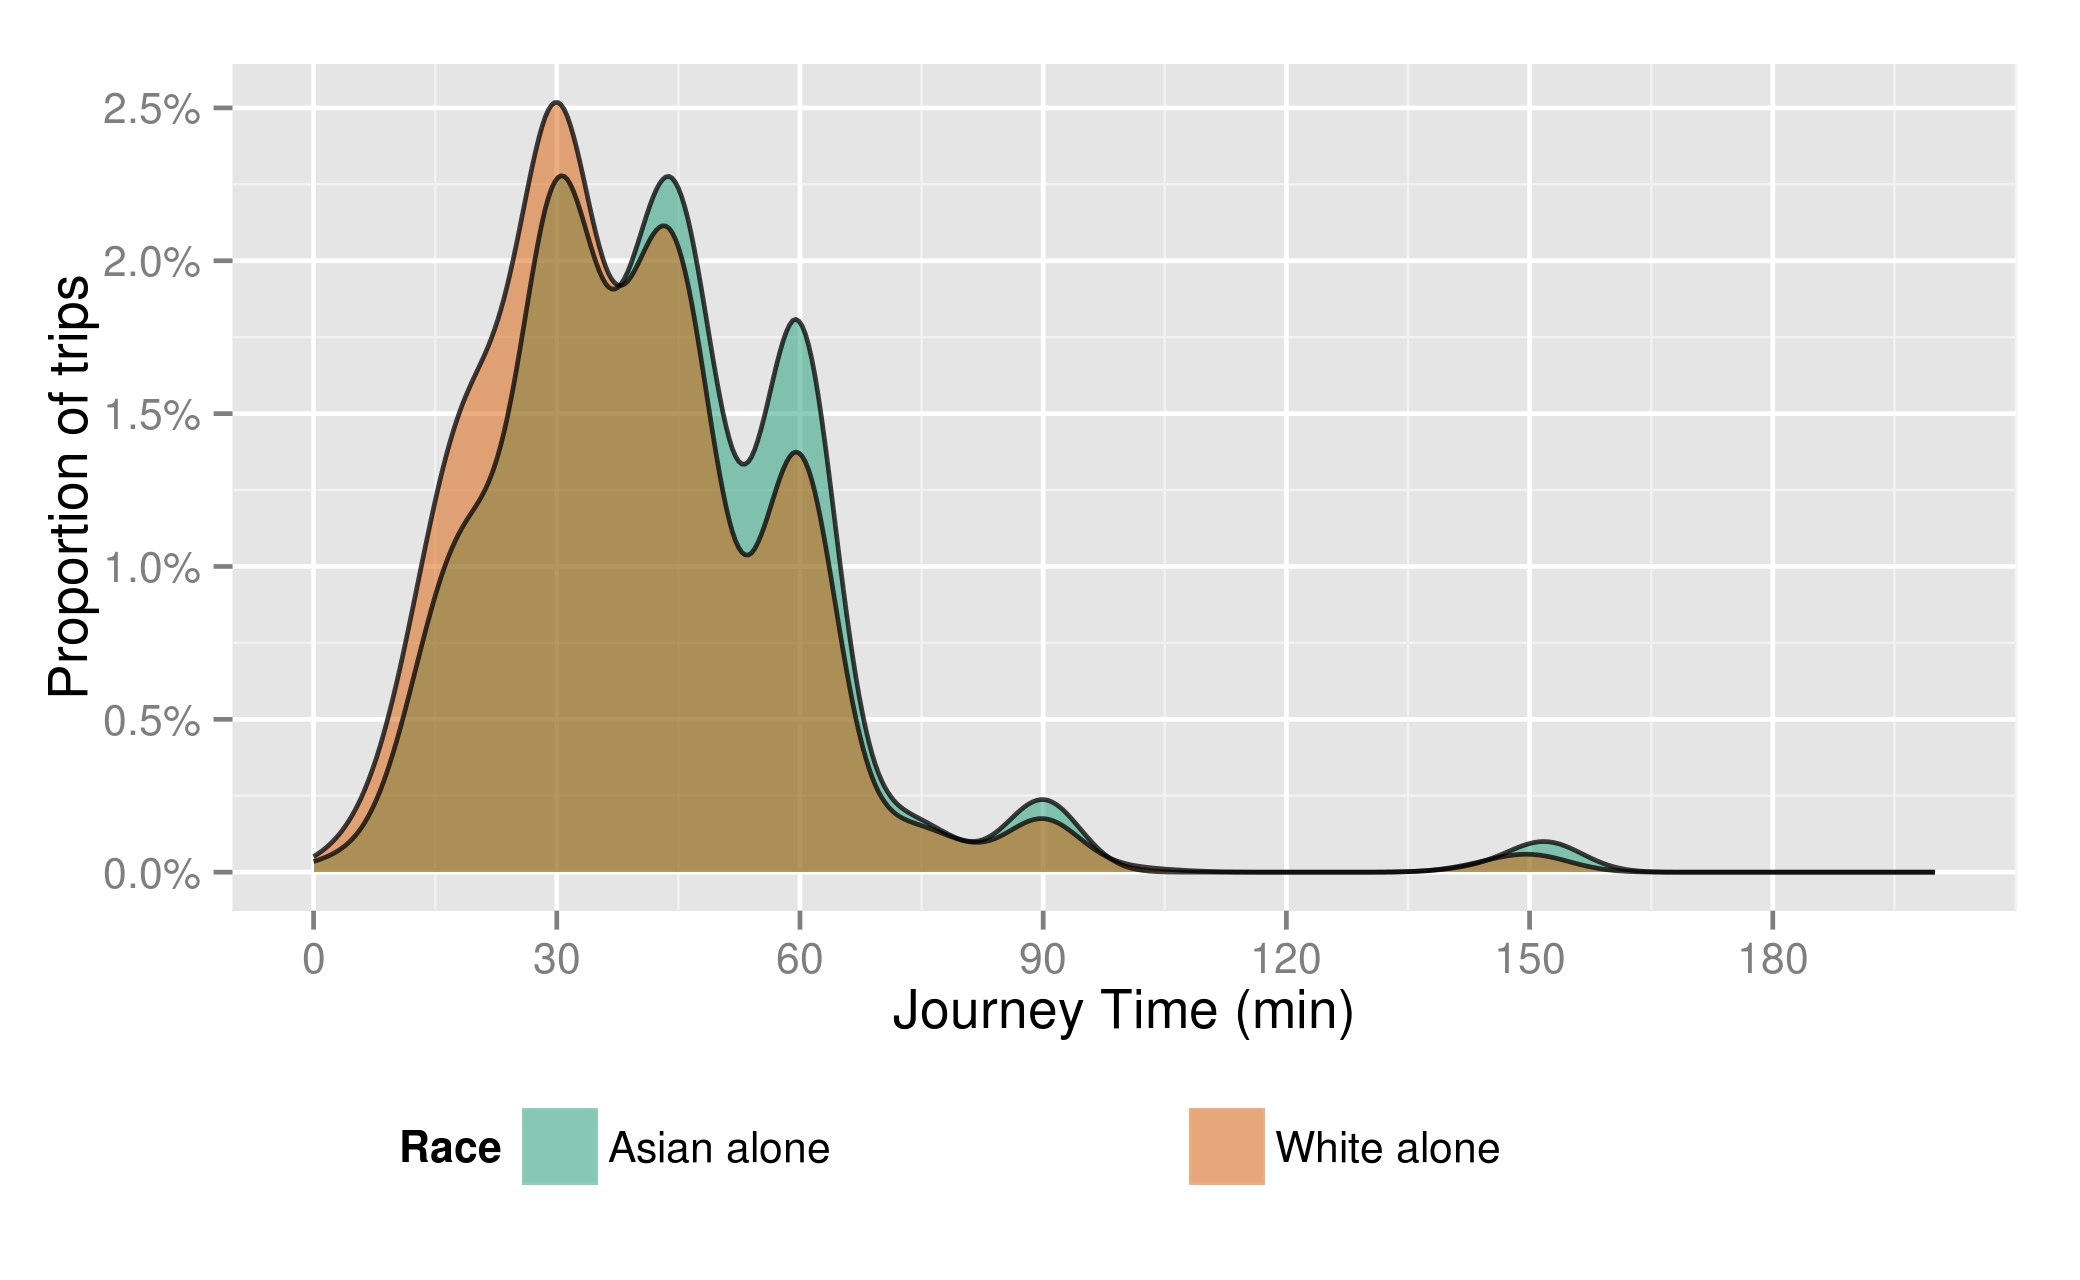
Figure 3.2 Journey to Work Time Distribution for Asian (Source: ACS 5-year 2013)
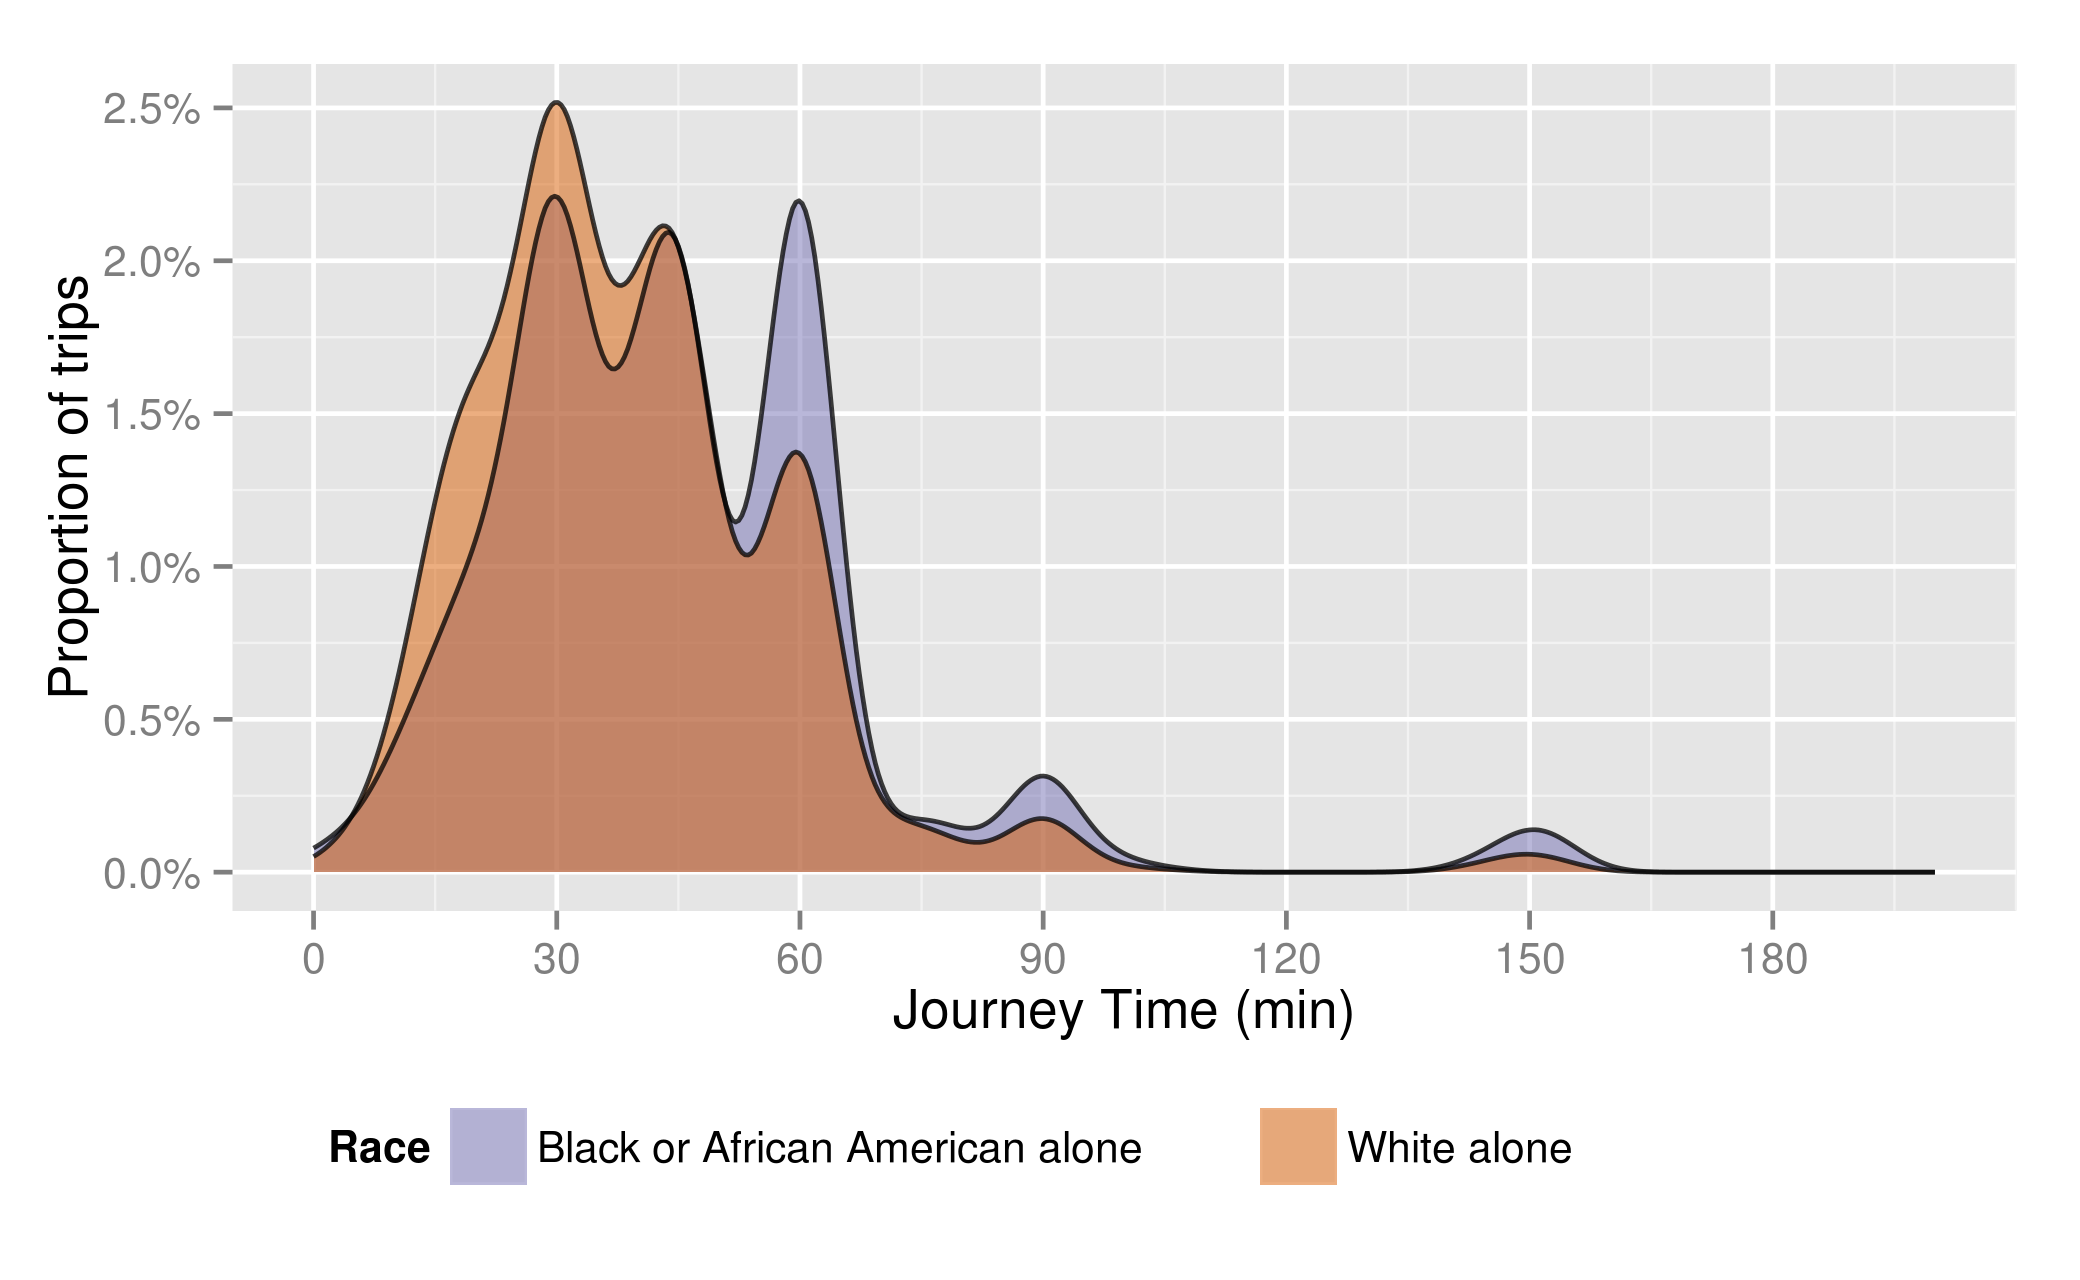
Figure 3.3 Journey to Work Time Distribution for Black or African American (Source: ACS 5-year 2013)
Since the Black-White differential is the highest, it will be the focus of this analysis since causes for travel time differences might be more readily apparent, and potential solutions could have a greater impact on reducing gaps in travel time. In the absence of survey data directly linking ethnicity to farecard data, it is necessary to infer this by other means. Chapter 4 will present a methodology for inferring home locations from observed travel, and how these locations can be linked to census demographics by tract. It is important to note that this is only possible within regions where public transit usage is spatially heterogeneous across demographic variables of interest such as race. If the population were well mixed, it would be impossible to examine how demographics play a role in transit provision without directly linking users’ ethnicity with their fare data. Figure 3.4 compares residential location of public transit commuters who identify as White and those who identify as Black or African American according to the American Community Survey (2013). Data is aggregated to census tracts instead of the PUMAs used above however “public transit” in this dataset includes commuter rail and commuter boat users. The thick black line was drawn around tracts which have a high concentration of Black transit users. This area, roughly representing the neighborhoods of Roxbury, Dorchester, and Mattapan, is 22.1% White, 58.6% Black and contains 21,504 Black public transit commuters. Assuming none of these Black public transit users commute via commuter rail, this represents roughly 2/3 of the Black rapid transit commuters in the MBTA’s service area.
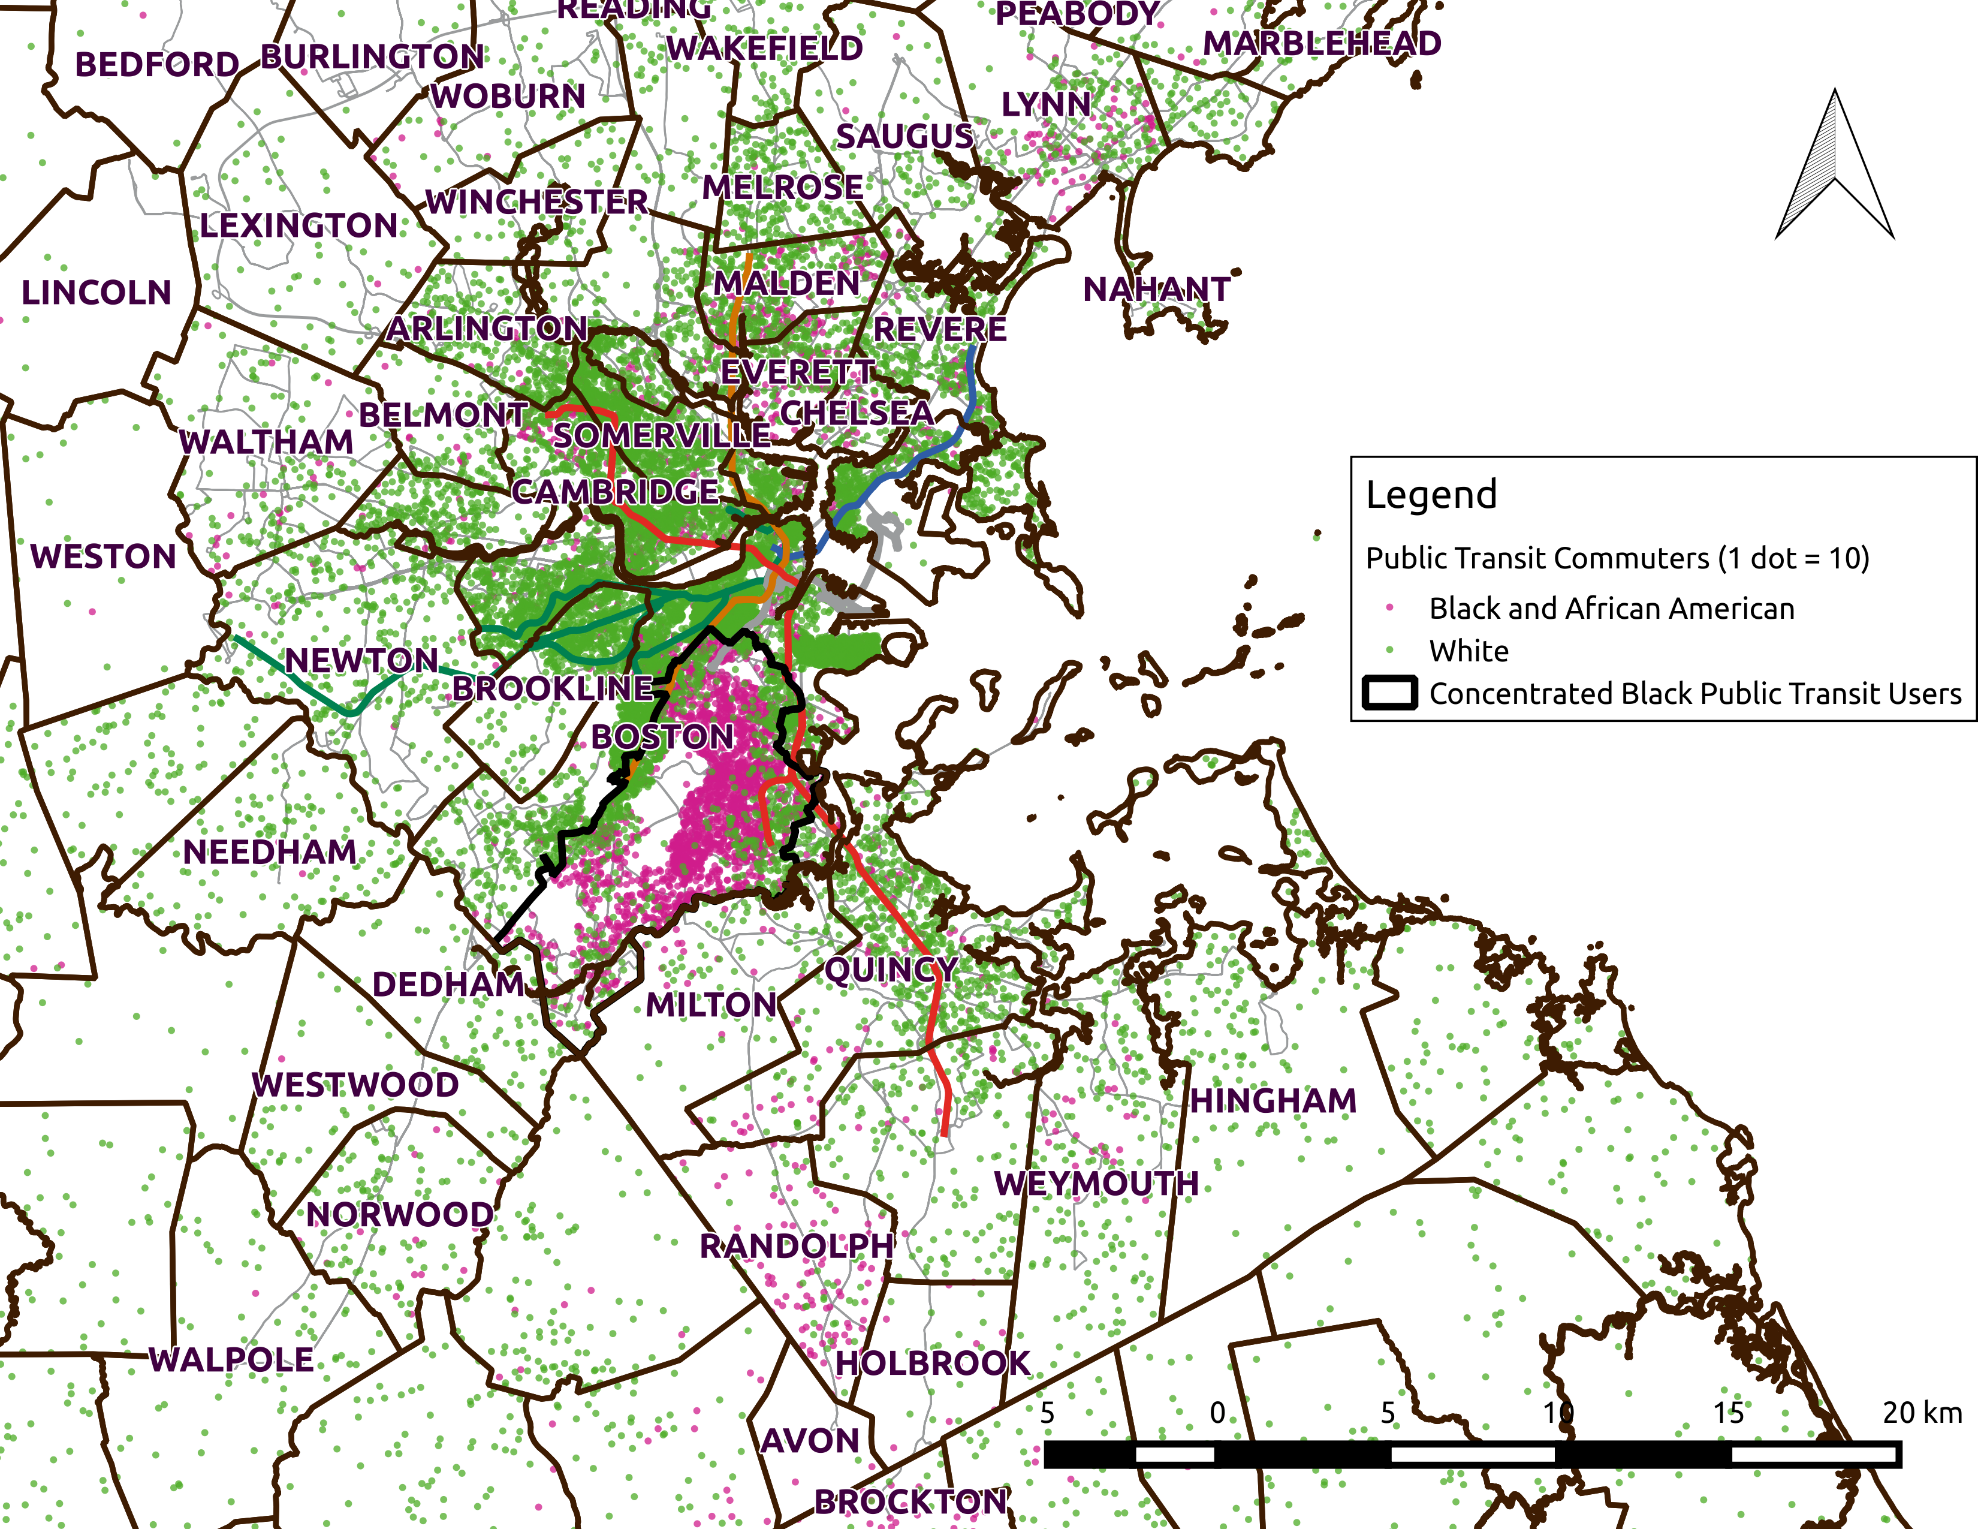
Figure 3.4 Public Transit Commuters by Race: Black and White
Summary
This chapter has detailed a history of Federal requirements for equity analysis of transit and transportation in the USA. Examples of the state of the practice and criticisms of the state of the practice found in the academic literature were presented. The use of inferred origins and destinations to generate passenger-centric metrics addresses the critiques of overly aggregate supply-derived metrics. These data provide more information than survey data from the Journey to Work section of the Census Bureau administered American Community Survey, allowing the analyst to identify solutions to mitigate observed differences in travel time. Subsequent chapters will present an example of an analysis of the spatial variation of travel time using inferred OD data. Chapter 4 discusses the necessary processing to filter a comparable sample of regular commuters from AFC, and the inference required to link home locations with public transit demographics aggregated by census tract. Chapter 5 presents the results of an analysis of travel times of users from areas with predominantly Black or African American public transit commuters compared to areas with predominantly White public transit commuters.